NCBI Bookshelf. A service of the National Library of Medicine, National Institutes of Health.
Walker HK, Hall WD, Hurst JW, editors. Clinical Methods: The History, Physical, and Laboratory Examinations. 3rd edition. Boston: Butterworths; 1990. Bookshelf ID: NBK354 PMID: 21250195
Definition
The electrocardiogram (ECG) records from the body surface and registers the differences in electrical potential generated by the heart. The signal recorded is determined by action potentials generated by millions of individual cells and their sequence of activation. A multitude of factors, both cardiac and extracardiac, alter the final electrical signal. For instance, the electrical forces generated by the heart are subsequently altered by the position of the heart within the body, the nature of the intervening tissue, and the distance to the recording electrode. Since the final, recorded electrical signal does not faithfully reflect the electrical activity of individual cells, the student should not expect the ECG necessarily to provide an exact anatomic or physiologic: "picture" of the heart. Nevertheless, as the result of careful correlation of electrocardiographic patterns with observed anatomic, pathologic, and physiologic data, it is now possible to deduce, with a high grade of accuracy, the state of the heart from the surface ECG. While it is true that the ECG may be normal despite an abnormal heart, or abnormal with a normal heart, it is equally true that the ECG often provides an important indication of a cardiac abnormality, and even allows a fairly accurate appraisal of the anatomic and physiologic significance of that abnormality. Furthermore, the ECG is by far the best method of analysis of disturbances of the cardiac rhythm.Technique
The frontal plane ECG is recorded from the supine, resting patient by attaching an electrode to each of the four extremities (Figure 33.1). Bipolar lead I records the difference of potential between the left arm and right arm, with the left arm serving as the positive pole, so that a current of electricity passing from right to left will be reflected as an upward deflection in lead I of the recording. Lead II records the difference in potential between the right arm and left leg, with the left leg serving as the positive pole. Lead III records the differences in potential between the left arm and left leg, with the left leg again positive. Three additional leads—the "augmented leads" aVR, aVL, and aVF—record the difference in potential between the right arm, left arm, or leg, respectively, and a ground lead formed by summing the other two unused limb leads. In each case, the positive pole is the designated limb. Taken together, these six leads record the cardiac electrical vectors throughout the entire 360° of the frontal plane (Figure 33.2).Vectors moving in the horizontal plane, in contrast, are reflected in the precordial leads, V1 through V6, which are placed on the anterior and left lateral chest in the positions shown in Figure 1C.
The V1 electrode position is located in the fourth right intercostal space adjacent to the sternum. The V2, electrode position is located in the fourth left intercostal space adjacent to the sternum. The V3 electrode position is located at the midpoint of a line connecting the electrode position for V2 and electrode position for V4. The V4 electrode position is located in the fifth left intercostal space in the midclavicular line. The V5 electrode position is located at the same level as the electrode position for V4 on the anterior axillary line. The V6 electrode position is located at the same level as the electrode positions for V4 and V5 on the midaxillary line. In each instance, the electrode serves as a positive pole, with the negative pole formed by electrically connecting all the limb leads so that an electrical current moving toward one of the precordial leads will be reflected as an upward deflection on the recording. Conversely, a vector moving toward the right posterior chest will be reflected as a negative deflection in the left anterior precordial leads. Thus, even though no electrodes are placed on the right posterolateral chest, vectors moving in any direction within the 360° of the horizontal plane will still be reflected in the six selected precordial leads.
The ECG instrument records each lead separately, either sequentially or, in some instruments, several leads can be recorded simultaneously. As the stylus moves, depending on the voltage it is reflecting, the recording paper moves at a constant, present speed of 25 mm/sec. Hence time is represented on the recording paper by the horizontal axis, and voltage is reflected in the vertical axis.
The signal is recorded on a grid, with lines 1 mm apart in both the vertical and horizontal axes. In the horizontal axis, each 1 mm represents 0.04 second (40 msec), and every 5 mm, designated by a bold line, indicates 0.2 second. The recording must be precisely standardized, so that 1 mm vertical deflection reflects 0.1 mV; 5 mm, again indicated by a more bold line, represents 0.5 mV (Figure 33.3). If the electrocardiogram is recorded at a different paper speed (such as twice the conventional rate) or with a voltage other than the conventional, these alterations must be recorded and taken into account when measuring the various intervals and waves of the ECG.
Waves, Intervals, and Segments
By convention, the first upward deflection from the baseline is termed the P wave, and it reflects atrial depolarization. The P wave should not exceed 2.5 mm in height nor 0.11 second in width (i.e., less than three small boxes high and wide).Ventricular depolarization is represented by the QRS complex. The Q wave is the first negative deflection from the baseline after the P wave, but preceding an upward deflection. Normally, the Q wave reflects ventricular septal depolarization, and its duration does not exceed 0.03 second. The R wave is the first positive deflection after the P wave, reflecting depolarization of the ventricular mass. The S wave is the negative deflection following the positive R wave representing later ventricular depolarization. Any positive deflection following an S wave is labeled R′ (read "R-prime"); any negative deflection following an R′ is labeled S′. By convention, an uppercase R or S infers a large deflection, whereas a lowercase r or s infers a smaller deflection.
The T wave reflects repolarization of the ventricle and may be represented as either a positive or negative deflection following the QRS complex. The area incorporated within the T wave approximates that within the QRS complex, and its polarity is roughly the same as the principal QRS polarity.
Occasionally, another wave, the U wave, may follow the T wave, and it is generally of the same polarity as the T wave. The mechanism of the U wave is unknown, though it may reflect repolarization of papillary muscles, or simply represent an afterpotential.
The PR interval is the time from the beginning of the P wave to the beginning of the QRS, whether initiated by a Q or an R, and this interval indicates the time required for the atria to depolarize, and for the electrical current to conduct through the atrioventricular node and bundle branches until the ventricle depolarizes. The QRS interval is that interval from the beginning of the Q wave to the end of the S wave, incorporating ventricular depolarization. The QT interval is the time from the beginning of the Q wave to the end of the T wave, incorporating both ventricular depolarization and repolarization.
The PR segment is that portion of the recording between the end of the P wave and the beginning of the QRS. The ST segment is that portion of the recording, generally represented by a horizontal line, from the end of ventricular depolarization, whether represented by an R wave or an S wave, to the beginning of the T wave.
Basic Science
In order to understand the mechanism of the recorded electrocardiographic patterns, it is essential to appreciate first of all the genesis of a single action potential; the derivation of the surface tracing from the cardiac cells; and the sequence of activation of the heart.Genesis of Cellular Action Potential
Adjacent to the cell, diagrammed in Figure 33.4, is the exquisitely fine tip of a microelectrode (a), which, since it has not yet been advanced into the cell, records nothing, that is, a difference in potential, or voltage, of zero. Once introduced into the cell, however (b), it records a negative potential of about 90 mV with respect to the outside of the cell. This inner negativity reflects a selective permeability of the membrane to potassium, such that there is a net loss of potassium, leaving the inside electrically negative.The cell remains in this negative or polarized state until, by one of two mechanisms, its negativity is reduced (it becomes more positive) to the threshold potential. The threshold potential is that potential at which the membrane's permeability to sodium is altered such that the cell can depolarize. Since the positive sodium ions move rapidly into the negative cell, the inside of the cell becomes more positive. In fact, before the sodium influx is arrested, the intracellular potential becomes absolutely positive, manifested by the so-called overshoot. This phase of depolarization is followed by restitution of the intracellular potential to normal—the phase of repolarization—which is accomplished by a loss of the positive intracellular potassium ion. Repolarization includes an early slow phase, termed the plateau, which is the result of a relative balance between the diminishing, inward calcium current and an increasing, outward potassium current, and a later rapid phase, due principally to potassium efflux.
These phases of the action potential are numbered: Phase 0 depicts depolarization; phase 1 refers to the overshoot or spike; phase 2 numbers the slow phase of repolarization; and phase 3 is the rapid phase of repolarization.
Derivation of Surface QRS-T from Cellular Action Potentials
It is important to understand this transmembrane action potential, both because the surface electrocardiogram is derived from it and because arrhythmias result from changes in the action potential of one or several cells.Consider pattern recognition first. Note in Figure 33.4 that the QRS is inscribed during the phases of depolarization, the ST segment during the isoelectric plateau, and the T wave during phase 3 rapid repolarization.
Changes in the intracellular action potential may be responsible for changes in the surface electrocardiogram. Consider the QT interval and T wave configuration, for example (Figure 33.4). In comparison with the normal action potential and surface QRS-T, an increase in extracellular potassium causes the resting membrane to be less negative; hence there is a slowing in phase 0 manifested by a slowing in the upstroke and prolongation of the QRS complex. Increased extracellular potassium also increases the permeability of each cell to potassium so that potassium efflux is hastened, resulting in a more rapid phase 2 and quicker phase 3. The foreshortening of the plateau and quickening of phase 3 result in a foreshortening of the QT interval with a peaked T wave. Conversely, hypokalemia results in a decreased permeability of the cell membrane to potassium so that phases 2 and 3 merge, resulting, in the surface tracing, in a prolongation in the QT with a flattening of the T and a more prominent U wave. With hypocalcemia, the plateau phase of the action potential is prolonged, resulting in a prolongation in the isoelectric ST interval. Conversely, with hypercalcemia, the QT interval is foreshortened as a result of an abbreviation of phase 2 and the isoelectric ST interval.
Derivation of Cardiac Rhythm from Cellular Action Potential
Recall that in order for the cell to propagate a transmembrane action potential, or depolarize, its resting potential must be brought to threshold. There are two mechanisms by which this may be accomplished. The first, and simplest, is electrically to stimulate the cell from an outside source. If the stimulus is too weak, the resting potential will be reduced but not to threshold, so no depolarization will occur. If the stimulus is sufficiently strong to reduce the resting potential to threshold, then a transmembrane action potential is propagated. Nearly all the cells in the heart are depolarized in this fashion; each cell is stimulated externally by its neighboring cell.The second mechanism by which the resting potential is reduced to threshold is termed automaticity. An automatic cell is one that displays a gradual, spontaneous loss of negativity during diastole, a phenomenon termed diastolic depolarization and numbered phase 4 of the transmembrane action potential (Figure 33.4).
In the heart there are two kinds of cells, electrically automatic and electrically nonautomatic. The muscle cells are generally nonautomatic. Their resting potential remains constant until the cell is stimulated to reach threshold. The automatic cell, on the other hand, demonstrates phase 4 diastolic depolarization (see Figure 33.4). Specialized cells in the sinus node, AV node, and the remainder of the His and Purkinje conducting system demonstrate automaticity. The cells with the most rapid slope of diastolic depolarization reach threshold first, so these are the cells, generally located in the sinus node, which control the rate of the heart. In other words, heart rate depends on the rapidity or slope of diastolic depolarization of the most automatic cells. The more rapid the slope, the earlier the cell reaches threshold and the faster the heart rate. Altered automaticity would be one cause of rhythm abnormalities.
A second common mechanism of rhythm disturbances is reentry. Considering the box in Figure 33.5A to represent the heart as a whole, consider one small segment, or cell. Reentry refers to the phenomenon of an impulse depolarizing this segment or cell, to produce an action potential or, on the surface ECG, a QRS complex, then traversing around another portion of the heart in a circuitous movement to reenter the first segment at a later time, eliciting a second response (a second QRS, for instance, on the surface ECG), such as a coupled premature ventricular complex.
Two conditions must prevail for reentry to occur. First, the impulse must leave the selected segment to conduct through other cardiac muscle. If the impulse that depolarized the first cell had conducted through the remainder of the heart, then the neighboring cells would be refractory; conduction into the circus pathway would not be possible. In other words, for the circus pathway to be excitable, the initial wave of depolarization must not have reached that pathway—that is, there must be unidirectional block (block forward into the reentry pathway, but not retrograde) into this portion of the pathway. Without unidirectional block, reentry would not have been possible.
Second, there must be a slowing in conduction. The heart requires about ⅓ second to recover, or to become re-excitable. If the impulse travels at a speed of 3 m/sec, which is about the speed of conduction expected in a Purkinje network, then the impulse would travel ⅓ sec × 3 m/sec, or 1 m before reentering the cell. Of course, the heart is not that large. So the only alternative explanation is that conduction must have been remarkably slowed.
Slowing in conduction is easily recognized at the level of the AV node by measuring the PR segment on the surface electrocardiogram. Thus, reentry can often be diagnosed or inferred from the surface electrocardiogram when reentry develops in the AV junction. On the other hand, slowing in conduction and reentry may not be so easily recognized in other portions of the heart.
With the help of a ladder diagram, which denotes electrical activation of the atrium, AV junction, and ventricle, consider the mechanism of a supraventricular tachycardia resulting from reentry at the level of the AV node (Figure 33.5B). The first two diagrammed complexes originate in the sinus node, with atrial activation conducting normally through the AV junction, with the appropriate AV and resultant PR delay, before depolarizing the ventricle. The third atrial activation, labeled A′ in the atrium and P′ on the surface ECG, occurs prematurely, thereby reaching the AV junction during its relative refractory period and conducting more slowly through the junction. Note the prolongation in the AV interval, and in the PR interval on the surface tracing. Recall that this slowing in conduction is a prerequisite for reentry so that this impulse may "turn around" in the junction to conduct retrograde back through the junction via a second pathway, to excite the atrium a second time—that is, the atrium has now been depolarized twice as a result of a single stimulus (which is the definition of reentry). This impulse, in turn, can conduct antegrade, though slowly, through the AV junction into the ventricle, and then reciprocate back and forth between the two chambers, resulting in a supraventricular tachycardia. After four such complexes a second premature complex, labeled A″ in the atrium and P″ in the ventricle, then occurs, conducting into the AV junction, thereby interrupting the retrograde path of the reentry circuit and terminating the tachycardia.
Clinically, the mechanism of reentrant supraventricular tachycardia can often be differentiated from a supraventricular tachycardia resulting from augmented automaticity, such as that resulting from digitalis excess. The latter is diagrammed in Figure 33.5C. Of course, the tachycardia must of necessity be initiated by a premature atrial complex (A′), but the premature complex is often later, reaching the AV junction after it has regained excitability, so that the PR interval is not prolonged. Then, rather than a regular tachycardia ensuing, the automatic focus generally "warms up" — that is, there is a gradual acceleration in the rate to the ultimate rate of the tachycardia. Finally, the automatic rate of the tachycardia is often not terminated by a premature atrial complex, but gradually slows before stopping. A reentrant supraventricular tachycardia can be initiated in the laboratory by an appropriately timed atrial stimulus, and terminated similarly. In contrast, automatic tachycardia can generally not be initiated and terminated by atrial pacing.
Figure 33.6 shows an example of accelerated idioventricular rhythm, or slow ventricular tachycardia, whose mechanism is presumably augmented automaticity of a focus in the ventricle. Study the first two complexes in the top tracing to determine the normal P wave, PR interval, and QRS. Compare these complexes with those in the middle of the second trace. Note that the PR interval is shorter. It is likely that each P wave has nothing to do with the ensuing QRS complex. Instead, as the sinus rate gradually slows, a hitherto unrecognized ventricular rhythm at a rate of about 101 cpm becomes manifest, and usurps control of the ventricle. The broad complexes are ventricular in origin, resulting from augmented automaticity of that focus. Toward the end of the middle trace, and in the bottom trace, as the sinus rate accelerates, as a result of increasing automaticity at the level of the sinus node, the atrium again captures and controls the ventricle.
Sequence of Activation; The Vector Concept
The surface ECG tracing is the result of summing the electricity generated from the multitude of cardiac cells. As the segment of myocardium diagrammed in Figure 33.7 depolarizes from the endocardium to the epicardium, an electrical force is generated. The force is termed a vector, and it is characterized by a given magnitude and direction. By convention, the positive pole of the vector is represented by an arrowhead; also, by convention, when the positive pole is directed toward an electrode the ECG stylus is deflected upward, whereas if the vector is directed away from an electrode, a negative deflection is recorded. The amplitude of the deflection depends on the magnitude of the vector. Thus, in Figure 33.7, as the vector is directed away from electrode A toward electrode B, a negative deflection is recorded in A, a positive deflection in B.Once that segment of muscle depolarizes, it must repolarize. If repolarization were in the same direction—that is, from endocardium to epicardium, but represented by the reinstitution of cell negativity, then the repolarization wave reflected on the surface tracing would be reflected in an identical complex, but in the opposite direction. In fact, repolarization of the ventricle travels in the opposite direction from depolarization, probably as a result of a delay in repolarization of the endocardium due to the intraluminal left ventricular cavity pressure. In addition, repolarization is slower than depolarization. Hence, repolarization, as reflected on the surface electrocardiogram, is slower, but in the same direction as depolarization. In general terms, however, the area subtended under the QRS complex approximately equals that under the T wave.
Next, to understand the surface electrocardiogram, consider the sequence of depolarization and repolarization of the heart (Figure 33.8).
Recall that the sinus node generally depolarizes more rapidly than other cells, so this is the first area of excitement; the sinus node is located in the upper right atrium. Its depolarization is of such low voltage that it is not recorded on the surface electrocardiogram, but atrial activation spreads from the sinus node downward and to the left (Vector A), depolarizing the right atrium just before the left, resulting in an upward P wave in leads I and the inferior leads, often with a notch, separating depolarization of the two atria, and with some terminal negativity in V1 (Figure 33.8).
The wave of depolarization conducts slowly from the atrium through the AV node into the bundle of His and the bundle branches. Again, the electricity generated by these tiny structures is insufficient to be recorded on the surface, so, instead, the isoelectric PR interval is recorded.
Having conducted through the AV conducting system to reach the ventricles, the wave of activation reaches a terminal portion of the shorter left bundle and hence the ventricular muscle on the left side of the septum before reaching the termination of the longer right bundle. Hence, the interventricular septum is first depolarized from left to right (Vector 1), reflected in an upward deflection in the right precordial leads (V1), but a negative deflection in the left precordial leads (V6). This initial wave of ventricular depolarization may be either superior (Vector 1a) or inferior (Vector 1b), so that either a small q or an r may be recorded in leads II, III, and aVF
Following septal depolarization, the apex and then the remainder of the ventricular free walls depolarize. By consideration of Figure 33.8, the student will note that the second wave of ventricular depolarization (Vector 2), at the apex of the ventricles, is, in general, isoelectric to the right and left precordial leads, so that the stylus returns to the baseline. The two ventricles depolarize at approximately the same time, but the larger left ventricular muscle generates more electrical voltage than the smaller right ventricular muscle, so that the net forces of Vector 3 are directed to the left and inferiorly, reflected in a negative stylus movement over the right precordium, but a positive R wave over the left precordium. Again, the stylus returns to the baseline as the superior left ventricular free wall and right ventricular outflow tract are finally depolarized, as diagrammed as Vector 4 in Figure 33.8.
Following phases 0 and 1 of the multiple transmembrane action potentials, the plateau or slow phase of repolarization (phase 2) is manifested on the surface ECG as the isoelectric ST segment. With more rapid repolarization, more apparent over the left ventricle than the right, the T wave is inscribed, subtending an area about equal to the QRS, but slower and more drawn out, and, in general, pointing in approximately the same direction as the QRS.
The Normal Electrocardiogram
The normal electrocardiogram begins with a P wave, reflecting depolarization of the atria, generally from right to left, and inferiorly. Thus, the atrial activation is represented on the surface electrocardiogram by a P wave that is upright in leads I, II, and III. Terminal negativity in the precordial lead V1 is normal, and represents later depolarization of the posteriorly located left atrium. The amplitude of the P wave should not exceed 2.5 mm (0.25 mv), and its duration should not exceed 0.11 second (less than three small boxes). The P wave may be notched, indicating separate right and left atrial activation.The PR segment is generally isoelectric. This segment may be deflected, however, by repolarization abnormalities of the atria, such as that resulting from atrial infarction or pericarditis.
The normal PR interval measures between 0.12 and 0.20 second.
The duration of the QRS complex measures between 0.06 and 0.10 second. The Q wave should not exceed 0.03 second, and its depth generally does not exceed 3 mm. The height of the R wave generally does not exceed 20 to 25 mm. The frontal axis of the QRS complex measures between −30° and 105°, indicating that the complex is principally positive in both lead I and lead II. The normal sequence of activation of the ventricle requires an rS in V1, gradually progressing into a larger R toward the left precordium, and a smaller S. A small q wave is generally recorded in the left limb and precordial leads, reflecting left to right septal activation.
The T wave generally points in the same direction as the QRS; the mean T vector should not be more than 30 to 45° divergent from the mean QRS vector. The area subtended by the T wave approximates that included within the QRS complex as well.
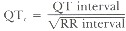
The normal QT interval is dependent upon heart rate. With the normal heart rate of approximately 70 cpm, the QT interval measures approximately 0.4 second. The QT interval can be corrected for heart rate (QT0) according to Bassett's formula:
The ST segment is normally isoelectric, and divergence of the ST interval from baseline often indicates clinically significant abnormalities. The ST interval is generally not of clinical significance unless the QT interval is foreshortened or prolonged, as, for example, with hyper- or hypocalcemia. respectively.
Axis
Precise calculation of electrical axis is usually unnecessary. The student simply needs to determine whether the axis is normal, deviated to the right ("right axis deviation"), or toward the left ("left axis deviation"). By convention, the normal axis ranges from − 30° to + 105° (Figure 33.2). Right axis deviation indicates an axis greater than 105°, and generally indicates either a predominance of right ventricular forces, resulting from right ventricular hypertrophy of any cause, or a loss of left lateral forces, such as that resulting from lateral wall infarction. Left axis deviation infers an axis to the left of − 30°, and is commonly the result of either left anterior hemiblock (to be discussed subsequently) or left ventricular predominance.To determine axis, visually calculate the area subtended by the positive and negative QRS deflections, and algebraically sum them. If the area is principally upright in lead I, then right axis deviation is excluded; right axis deviation is defined as an axis greater than 105°, which would be reflected by a principally negative deflection in lead I. Similarily, if the QRS complex in lead II is principally positive, then left axis deviation is excluded since, by definition, left axis deviation is to the left or negative side of − 30°, which is perpendicular to lead II. In other words, the student can immediately determine that the axis is normal by simply observing principally upright deflections in both leads I and II. Left axis deviation will be diagnosed by an S wave exceeding the R wave in lead II; right axis deviation will be diagnosed by the S wave exceeding the R wave in lead I. One may calculate the QRS axis more precisely by determining the relative positivity–negativity in each of the limb leads, and hence placing the resultant vector.
Clinical Significance
Arrhythmias
Bradycardia
The heart rate may be slow (less than the arbitrarily defined lower limit of 60 cpm) for one of two reasons: The atria are slow—atrial bradycardia; or there is a block in conduction between the atria and ventricles—atrioventricular or AV block.There are three varieties of atrial bradycardia: sinus bradycardia, sinus exit block, and sinus arrest. Sinus bradycardia is characterized by a normal sequence of activation, with the impulse arising in the sinus node and a normal P wave, but the rate is less than 60 cpm. Sinus exit block is characterized by a block in conduction surrounding the sinus node, so the sinus pacemaker may function normally, but the impulse fails to exit from the sinus node to excite the atria. On the surface ECG, sinus exit block is characterized by periodic pauses which are exact multiples of the sinus intervals. For instance, in Figure 33.9, pauses are recorded that represent two (2:1), three (3:1) or four (4:1 sinoatrial ratio) sinus intervals. Since the P wave following the pause is precisely timed with the expected sinus interval, we may assume that the sinus node discharged appropriately during the interval, but the impulse failed to exit from the sinus node to excite the atrium and generate a P wave. Sinus arrest is represented by total cessation of atrial activation, with or without prior slowing of the sinus rate.
AV conduction may block at one of two levels: at the level of the AV node or beyond the bifurcation of the bundle of His—that is, at the level of the bundles or ventricle (Figure 33.10). Block at the level of the AV node may be termed AV nodal block, Type I block, or supra-His block. Clinically, it is helpful to consider this a variety of supraventricular block, since the abnormality is above the level of the ventricles. Regardless of where the block occurs, three different degrees of block are possible. First degree block refers to a slowing in AV conduction, with a resultant prolongation in the PR interval, though each P wave does succeed in conducting through the AV conducting system to activate the ventricle (Figure 33.11A). Second degree block indicates that some of the P waves conduct through the AV junction, but others fail to excite the ventricle. When second degree block develops at the level of the AV node (Type I), it is invariably Wenckebach in type, characterized by a progressive prolongation in the PR interval until a P wave fails to traverse the AV conducting system to excite the ventricle (Figure 33.11B). Classically, the increment in the PR interval is decremental. Consequently, with Wenckebach second degree block of the AV node, although there is a progressive prolongation in the PR interval, the RR interval commonly decreases until the pause, which measures less than two PP intervals. This timing may be better understood by reference to the diagram in Figure 33.12. Third degree block is complete block—that is, none of the P waves succeed in traversing the AV conduction system to depolarize the ventricle. When third degree block develops at the level of the AV node (Type I), a focus lower in the AV junction generally escapes to conduct into the ventricle, and the escape rate may be only slightly less than a normal sinus rate (Figure 33.11C).
When block develops below the bifurcation of the bundle of His, at the level of the intraventricular conduction system, it is termed infra-His, bilateral bundle branch block, or Type II block. Clinically, it is well to recall that this is block at the level of the ventricles, so it may be termed ventricular block. Again, the block may develop in any of three degrees. First degree block, characterized by prolongation of the PR interval, is recognized by the coexistent prolongation in intraventricular conduction. Second degree block at this level is termed Mobitz II (Wenckebach block may also be referred to as Mobitz I). Mobitz II block is characterized by a constant PR interval until a P wave suddenly fails to conduct to the ventricle, with a resultant pause. Invariably, the QRS is prolonged with a bundle branch block pattern. Third degree, or complete block, at the level of the ventricles is characterized by an extraordinarily slow ventricular response, since any escape focus beneath this level of block has a very slow intrinsic rate.
Figure 33.13 shows an example of infra-His block. In lead V1, note that each P wave is followed after a markedly prolonged PR interval by a QRS with right bundle branch block conduction delay. This would indicate first degree infra-His block. In lead aVR, the third P wave suddenly fails to conduct to the ventricle, whereas the preceding P waves did conduct with a fixed PR interval. This is an example of Mobitz II, second degree infra-His (Type II) block, and the "escape" focus is a previously positioned demand pace maker. Were it not for the pacemaker, the patient may have manifested complete heart block, with an exceedingly slow, if any, ventricular escape.
As indicated above, the first determination that the student must make in interpreting a bradycardia is its origin: supraventricular or ventricular (see Figure 33.10). The etiology of the abnormality, the prognosis of the patient, and the therapy are much more dependent upon the site of origin of the bradycardia than the precise rhythm disturbance or the degree of block. Thus, if the abnormality is supraventricular, either one of the three atrial varieties or one of the three degrees of AV block, the cause may be high vagal tone, digitalis, ischemia or infarction of the inferior wall of the heart. Wenckebach block may even be a normal finding in a healthy young adult. The prognosis is generally good. If any therapy is required (and it commonly is not), vagolytic therapy with atropine or low-dose catecholamine infusion may suffice. Cardiac pacing is infrequently required.
Conversely, if the block is at the level of the ventricles, it is never normal. The cause may be idiopathic degeneration of the cardiac skeleton and adjacent conducting system (Lev's disease), toxic amounts of certain drugs, or infarction of the anterior wall and interventricular septum. Depending upon the etiology, the prognosis may be much worse, with syncope or even death more likely to ensue when the cause is myocardial infarction. Vagolytic agents will not accelerate intraventricular conduction, and either catecholamines (as an emergency measure) or cardiac pacing may be indicated.
For instance, consider a single etiology: myocardial ischemia or infarction. With knowledge of the coronary arterial distribution and, more particularly, the coronary supply of the essential pacemaker and conducting sites in the heart, one can predict which bradycardia is likely to complicate a given myocardial infarction.
In Figure 33.14A we have diagrammed the conducting system of the heart, as seen in the lateral view from the right side of the interventricular septum. The conduction system (the sinus node, AV node, bundle of His, and right bundle, on the right side of the septum) is stippled. The right coronary artery (RCA) arises from the right sinus of Valsalva, courses to the right in the AV groove, and then turns sharply, at the crux of the heart, to descend in the posterior interventricular groove as the posterior descending artery. As such, it supplies the posterior and inferior surface of the heart, so that an occlusion of the RCA generally results in an inferior wall or "diaphragmatic" infarction. In the majority of hearts, the RCA sends a large branch near its origin to the sinus node—the sinus node artery. Occlusion of the RCA near its origin, then, usually induces ischemia in the SA node, so its pacemaker function slows, resulting in sinus bradycardia. Actually, the SA node, per se, is not damaged so much as the area of junction between the node and the atrium, so sinus node exit block may develop. Or, the sinus node may fail altogether, resulting in sinus arrest.
At the crux of the heart, where the RCA bends, it gives off another large branch in most hearts to nurture the AV node—the AV nodal artery. Rarely is the AV node infarcted and necrotic, but it is ischemic in the setting of acute inferior wall infarction. Even if the node, per se, were not ischemic, the area surrounding it is; this area contains a plethora of cholinergic ganglia, ischemia of which results in release of acetylcholine, thus mimicking vagal stimulation and slowing conduction through the AV node. The result may be either first, second, or third degree AV (Type I) block. Consequently, an inferior wall infarction is commonly associated with temporary, reversible ischemia of either the sinus node or AV node, resulting in any variety of supraventricular bradycardia. Unless the rate is extremely slow, no therapy is usually required.
Conversely, consider Figure 33.14B, which diagrams the conducting system and coronary distribution from the left side of the septum. The left coronary artery descends in the anterior interventricular groove as the left anterior descending coronary artery (LAD), and, as such, nurtures the main left bundle, both divisions of the left bundle, and also the right bundle (on the other side of the septum). Quite significantly, the LAD also supplies a huge mass of muscle, the interventricular septum, and the anterior papillary muscle, so that the student can also envision potential problems with heart failure, shock, and mitral regurgitation, regardless of any conduction disturbance.
If occlusion of the LAD is associated with bradycardia, then the explanation is generally infra-His or Type II block. The conduction system may be not only ischemic, but infarcted and the block may be irreversible. The ventricular escape is much slower, and the prognosis much worse. Cardiac pacing is generally required as an emergency, and, even then, the prognosis is poor. Figure 33.15 provides an example of Type II block in the setting of acute anterior wall infarction.
Tachycardia
Exactly as with the bradycardias, it is essential to distinguish between the tachycardias of supraventricular origin and those of ventricular origin, since, again, the etiology, prognosis, and therapy differ between the two. The essential clinical features differentiating between the various tachycardias are listed in Table 33.1.Though overly simplistic, supraventricular tachycardias can generally be divided into three types: paroxysmal supraventricular tachycardia (PSVT), atrial flutter, and atrial fibrillation. PSVT commonly occurs in otherwise normal hearts. Atrial flutter and atrial fibrillation imply cardiac disease of a variety of types, including hypertensive, cardiomyopathic, ischemic, and valvular disease.
The rate of PSVT is generally quite rapid, in the range of 170 to 250 cpm (Figure 33.16A). The rhythm is quite regular. To auscultation, the first heart sound is of constant intensity—so constant, in fact, as to prove "monotonous." With carotid sinus massage, the tachycardia may terminate.
With atrial flutter, the atrial rate is too rapid—300 cpm—to traverse the AV conduction system. Hence, only every other atrial impulse traverses the system to excite the ventricle, with a resultant 2 : 1 atrioventricular ratio or a ventricular rate of 150 cpm (Figure 33.16B). Again, the rhythm is generally regular, and the first heart sound relatively constant in intensity. With carotid sinus massage, the atrial flutter persists, but the ratio of AV block may increase from 2 : 1 to 4 : 1, with a consequent halving of the ventricular rate transiently.
The atria depolarize at 400 to 600 cpm with atrial fibrillation; of course, not all of these impulses can traverse the AV node, but they reach the AV node at varying intervals, conducting for varying distances into the node, resulting in a variable ventricular response, which is quite irregular (Figure 33.16C). The first heart sound may vary somewhat in intensity, depending upon the irregularity of the pulse. With carotid sinus massage, there may be transient slowing of the ventricular response.
Reference to the electrocardiograms (Figure 33.16) shows that the duration of the QRS is generally normal in the supraventricular tachycardias. This is not essential to the diagnosis, however, since the QRS could be prolonged due to an underlying bundle branch block, or intraventricular conduction may be slowed as a result of the excessively rapid depolarization of the ventricular conducting system.
Ventricular tachycardia is never normal, but complicates heart disease of all varieties, particularly ischemic and cardiomyopathic disease. Unlike most varieties of supraventricular tachycardia, ventricular tachycardia may be lethal. The prognosis depends on the underlying heart disease.
The duration of the QRS on the ECG in ventricular tachycardia is almost always prolonged, generally in excess of 140 msec (0.14 sec); however, the rate is quite variable. When less than 100 cpm, the ventricular tachycardia is termed "slow" ventricular tachycardia or accelerated idioventricular rhythm (see Figure 33.6). Conversely, the rate may reach as high as 280 cpm. Typically, ventricular tachycardia displays a rate of 150 to 180 cpm. The rhythm is generally fairly regular.
Commonly, the atria and ventricles are dissociated during ventricular tachycardia—that is, the atria continue to depolarize at a normal or slightly accelerated rate, for instance 100 cpm, whereas the ventricle is depolarized at a more rapid rate. This AV dissociation results in diagnostic: physical findings. When the right atrium contracts against a closed tricuspid valve (resulting from a preceding ventricular contraction), a retrograde, "cannon" a wave is seen in the jugular vein. Because of varying positions of the AV valves, dependent upon the timing of contraction of the chambers, the intensity of the first heart sound varies from beat to beat. If a ventricular contraction is preceded by an appropriately timed atrial contraction, the pulse and blood pressure will be higher than if inappropriate timing occurs. These three findings—cannon a waves, variable intensity of the first heart sound, and variations of the systolic blood pressure—are extremely helpful bedside hints as to the origin of the tachycardia.
With AV dissociation, periodically an appropriately timed atrial complex may conduct through the AV conducting system to "capture" the ventricle prematurely. Electrocardiographically, this is recognized as a complex which is slightly premature, follows a P wave, is conducted more normally, and has a narrower QRS complex. If the capture is so timed that a portion of the ventricle is depolarized from above, but another portion of the ventricle depolarized from the site of the ventricular tachycardia, the result is a "fusion" of the two complexes—one of supra-ventricular and one of ventricular origin. The resultant QRS will be intermediate in configuration between the two origins (Figures 33.6 and 33.17).
Ventricular fibrillation refers to completely disorganized electrical activation of the ventricles. There is no effective ventricular contraction, and death is imminent if the fibrillation is not immediately converted (Figure 33.18).
The clinical bedside findings may help to distinguish between the various tachycardias. More commonly, an EGG is essential to the differential diagnosis. If the duration of the QRS is narrow, one may be fairly certain that the tachycardia is supraventricular in origin. If the duration of the QRS is quite broad, one is approximately 95% certain that the tachycardia is ventricular in origin. On the other hand, approximately 5% of supraventricular tachycardias may conduct with prolonged QRS complexes. The explanation may be a preexistent bundle branch block or aberrant conduction of the rapid supraventricular complexes.
Thus, with a tachycardia and broad QRS, one must distinguish between a ventricular tachycardia and a supraventricular tachycardia conducting aberrantly. Aberrancy refers to abnormally prolonged, intraventricular conduction of an impulse of supraventricular origin. This is the result of an alteration in heart rate, a change in cycle length, or some other functional abnormality. Aberration does not refer to a fixed bundle branch block.
When the supraventricular rate is too rapid (greater than 170 cpm), the impulses may reach the ventricle prior to full repolarization and recovery of excitability of the action potentials in the conducting system; consequently, the impulses conduct aberrantly. In addition, the refractory period of a given impulse is directly related to the preceding RR interval. The longer this interval, the longer its refractory period, and the more likely a subsequent impulse will conduct aberrantly if it occurs relatively prematurely. In other words, when a long interval (which prolongs the refractory period) is followed by a short interval, then the impulse following the short interval may reach the conducting system when still refractory, thus conducting aberrantly. This is referred to as the Ashman phenomenon (Figure 33.9).
Thus, the heart rate, the rhythm, certain physical findings, the duration of the QRS, the relationship between atrial and ventricular depolarization (if seen), and captures and fusions help one distinguish between supraventricular tachycardias with a broad QRS and ventricular tachycardias. The configuration of the QRS in the precordial leads is also helpful. Many of these distinguishing features are listed in Table 33.2.
Patterns
Common EGG abnormalities have been selected to illustrate the application of the technique of pattern recognition. In each instance, the diagnostic criteria are listed, followed by a brief description of the responsible vectors. The altered vectors responsible for the abnormal QRS complexes are diagrammed in Figure 33.19.The pattern of right bundle branch block is:
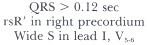
Recall that right bundle branch block may be functional, resulting from a supraventricular tachycardia or the Ashman phenomenon, when any delay in depolarization of the right bundle allows the left bundle to depolarize first.
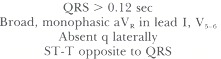
The pattern of left bundle branch block is:
The pattern of left anterior hemiblock is:
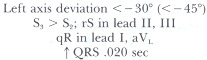
With block in the left anterior hemidivision (left anterior hemiblock) the left ventricle must initially depolarize via the left posterior hemifascicle so the initial vector will be directed inferiorly, toward leads II, III and aVF and away from leads I and aVL (Vector A in Figure 33.19C). Hence, an R wave will be recorded in the inferior leads, and a Q wave in the lateral leads. Subsequently, the vector will move in the direction of the anterolateral left ventricle or toward leads I and aVL and away from the inferior leads (Vector B), resulting in a tall R wave laterally and deep S wave inferiorly. The QRS will be prolonged by about 20 msec; the resultant duration of the QRS will depend on its initial duration. To diagnose left anterior hemiblock, one must record an rS deflection in the inferior leads, with the S deeper than the r is tall, resulting in an abnormal left axis deviation to the left of −30° (or −45°). Furthermore, since vector 3 is directed more away from lead III than lead II, the S in lead III must exceed the S in lead II.
With left posterior hemiblock, the exact opposite condition prevails, so that the qR is recorded in the inferior leads, and an rS in the anterolateral leads. Left posterior hemiblock is much, much less common than left anterior hemiblock.
When the electrocardiographic criteria for RBBB and LAH are combined, the result is termed bifascicular block. When coupled with first degree AV block, this may represent trifascicular block—that is, RBBB and LAH plus first degree block of the remaining left posterior hemifascicle (see Figures 33.13 and 33.20). If, on the other hand, the prolongation in the PR interval is a result of a delay in conduction across the AV node, then this would indicate bifascicular block with first degree AV block, not trifascicular.
The right ventricle is an anterior, right-sided structure, so right ventricular hypertrophy (RVH) results in a principal QRS vector directed toward lead V1. The ECG criteria for RVH are:
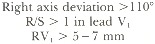
With a systolic or pressure overload but right ventricular pressure less than or equal to left ventricular pressure, a tall R is recorded in V1, with a delta wave or slurring of the upstroke (Figure 33.22). When right ventricular pressure exceeds left ventricular pressure (severe pulmonary hypertension or pulmonic stenosis), either a pure R or qR is recorded in V1.
In Figure 33.23, the R exceeds the s in V1 and the axis is rightward, suggesting right ventricular hypertrophy. However, the QRS in V1, is quite "squat" and the absence of a deeper s might suggest that the left ventricle is relatively small. This plus the coexistent left atrial abnormality is highly suggestive of the cause—mitral stenosis.
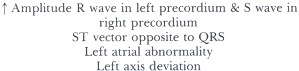
The pattern of left ventricular hypertrophy is:
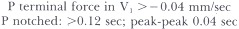
Left atrial abnormality shows the following pattern:
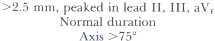
Right atrial abnormality is characterized by:
Myocardial Infarction
Myocardial infarction is generally manifested as Q waves (or absence of R waves) due to electrical silence of the scarred zone, with the resultant vectors pointing away from the infarction. Table 33.3 indicates the ECG waves associated with myocardial infarctions at various locations.With anterior myocardial infarction, there is an absence of R wave, replaced by an abnormal qS complex, in the anterior precordial leads and generally in the limb leads recording over the left ventricle—that is, leads I and aVL. Attempts have been made to localize the anterior infarction more specifically to the septum (V1–2), anterolateral wall (V5–6) or free anterior wall (V3–4). Figure 33.25 provides examples: frankly, however, the correlation between the electrocardiographic diagnosis and the pathological demonstration is highly variable.
With inferior myocardial infarction, the R wave is replaced by a pathological Q wave exceeding 0.03 sec in duration (Figure 33.26) in leads II, III and aVF.
True posterior infarction is demonstrated less directly. Electrodes are not conventionally placed over the back, so that an infarction of the posterior wall of the ventricle is not recorded as pathological Q waves posteriorly. On the other hand, the resultant initial vector must be directed anteriorly, away from the posterior wall, resulting in an abnormal, upward early deflection (R wave) in the right precordial leads. Figure 33.26 displays an inferoposterior infarction, which resulted from occlusion of a large right coronary artery.
Repolarization abnormalities are seen in ischemic injury to the myocardium. Recall that the normal T wave vector is in the same direction as the normal QRS vector, since depolarization and repolarization progress in opposite directions while opposite electrical forces are generated by repolarization. In contrast, with ischemia, repolarization is delayed, reversing the polarity of the T wave, so that T wave inversion is recorded in leads which traditionally record upright T waves. With "injury" to the myocardium, depolarization may be delayed in that zone, resulting in a "current of injury" pointing toward the area of injury. Thus, ST segment elevation is recorded in those leads overlying the injured zone (Figure 33.26).
The timing of a myocardial injury–infarction is not precise. However, the patterns diagrammatically displayed in Figure 33.27 typify myocardial infarction in various stages of development. The earliest electrocardiographic indication of myocardial injury may be a subtle increase in the amplitude of the T wave. Then the ST segments elevate, generally concave upward. Within a few minutes the ST segment elevation is generally convex upward, with less impressive T wave amplification. Within hours the R wave may diminish in amplitude, an abnormal Q wave begins to develop, and the ST segment elevation diminishes. After 4 to 6 hours, and extending to days, pathologic Q waves increase in duration with further loss of R wave and a return in the ST segment toward the baseline. The electrocardiographic indication of a chronic infarction is a pathological Q wave, with consequent loss of R wave activity, generally isoelectric ST segments, and inversion of the T waves in those leads that record Q waves.
Other ST and T Wave Abnormalities
In the Basic Science section, we discussed repolarizalion abnormalities accompanying electrolyte fluxes. An entire host of events can alter repolarization and hence the ST–T segment, including ischemia, hypoxemia, electrolyte abnormalities (potassium, calcium, magnesium), drugs (digitalis, antiarrhythmics, tricyclic antidepressants), and virtually any disease affecting the myocardium (myocarditis, cardiomyopathy, trauma, tumor). Thus, repolarization abnormalities are generally quite nonspecific and require clinical correlation for interpretation.One sort of ST–T wave abnormality that is fairly diagnostic, however, is that resulting from pericarditis. Here, the ST segment is directed toward the epicardium (left, inferiorly, anteriorly), resulting in ST segment elevation in those leads but ST depression in leads aVR and V1 The ST elevation is generally concave upward and the T wave upright in those same leads, at least early in the course of pericarditis, though later the T waves will commonly invert in those same leads. The PR vector is directed toward the atria, in an opposite direction, so that the PR segment is depressed in the same leads that ST segment elevation is recorded (Figure 33.28).
Thus, the ECG is an extraordinarily useful method for evaluation of the state of the heart's structure, function, and rhythm.
The authors are indebted to Mr. Phillip Wilson, medical illustrator, and Mrs. Karen Deering, secretary, for their help.
References
- Castellanos A, Myersburg RJ. The resting electrocardiogram. In: Hurst JW ed. The heart, 6th ed. New York, McGraw-Hill, 1986;206–29.
- Chung EK. Practical applications with vectoral principles. 3rd ed. Norwalk: Appleton-Century-Crofts, 1985.
- Fisch C. Electrocardiography and vectorcardiography. In: Braunwald EU, ed. Heart disease: a textbook of cardiovascular medicine, 2nd ed. Philadelphia: W. B. Saunders, 1984;1:195–257.
- Scheidt S. Basic electrocardiography: leads, axes, arrhythmias. Clin Sym 1983;35(2). CIBA Pharmaceutical Company, Summit, NJ.
- Scheidt S. Basic electrocardiography: abnormalities of electrocardiograhic patterns. Clin Sym 1984;35(2). CIBA Pharmaceutical Company, Summit, NJ.
Figures

Figure 33.1
Electrocardiographic leads.
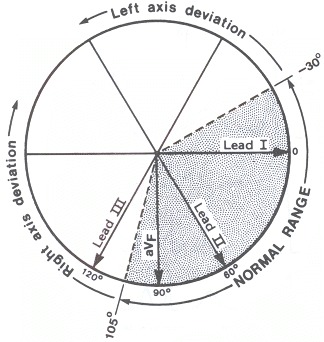
Figure 33.2
Axis.
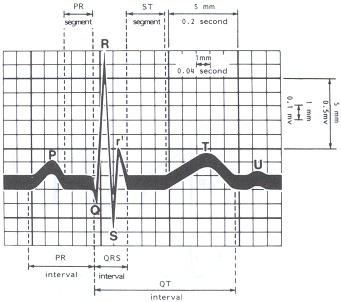
Figure 33.3
ECG grid. Waves, intervals,
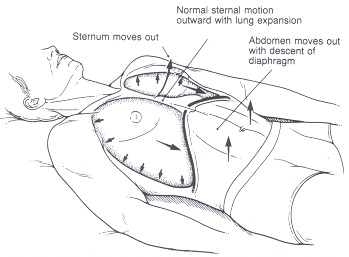
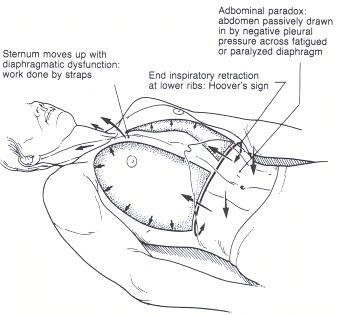
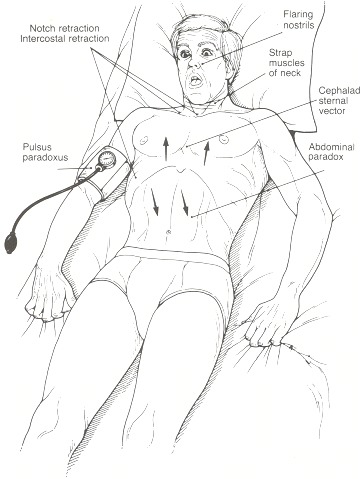
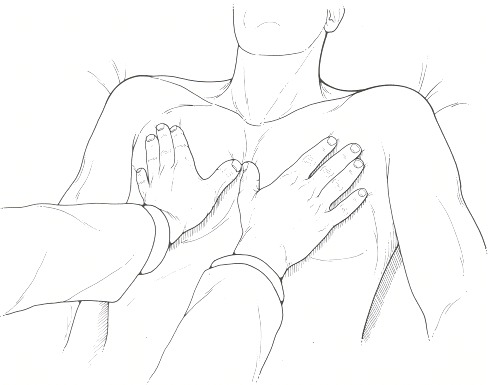
 Respiratory rate, depth