Information that can be derived from an assessment of the jugular venous pulse includes determination of the mean venous pressure, venous pulse contour, and presence and type of cardiac dysrhythmias.
The jugular venous pressure is usually assessed by observing the right side of the patient's neck. The normal mean jugular venous pressure, determined as the vertical distance above the midpoint of the right atrium, is 6 to 8 cm H2O. Deviations from this normal range reflect either hypovolemia (i.e., mean venous pressure less than 5 cm H2O) or impaired cardiac filling (i.e., mean venous pressure greater than 9 cm H2O). The normal jugular venous pulse contains three positive waves. By convention these are labeled "a," "c", and "v" (Figure 19.1). These positive deflections occur, respectively, before the carotid upstroke and just after the P wave of the ECG (a wave); simultaneous with the upstroke of the carotid pulse (c wave); and during ventricular systole until the tricuspid valve opens (v wave). The a wave is generated by atrial contraction, which actively fills the right ventricle in end-diastole. The c wave is caused either by transmission of the carotid arterial impulse through the external and internal jugular veins or by the bulging of the tricuspid valve into the right atrium in early systole. The v wave reflects the passive increase in pressure and volume of the right atrium as it fills in late systole and early diastole. Normally the crests of the a and v waves are approximately equal in amplitude. The descents or troughs (Figure 19.1) of the jugular venous pulse occur between the "a" and "c" wave ("x" descent), between the "c" and "v" wave ("x" descent), and between the "v" and "a" wave ("y" descent). The x and x′ descents reflect movement of the lower portion of the right atrium toward the right ventricle during the final phases of ventricular systole. The y descent represents the abrupt termination of the downstroke of the v wave during early diastole after the tricuspid valve opens and the right ventricle begins to fill passively. Normally the y descent is neither as brisk nor as deep as the x descent.
 Abnormalities in the jugular venous pulse may be reflected in either the mean pressure, amplitude, or configuration of the positive waves or negative troughs, or in the sequence or absence of the positive waves. In this chapter emphasis is placed on measurement of the jugular venous pressure, use of the venous pulse to determine cardiac rhythm, and the more common cardiac problems of pulmonary hypertension, tricuspid regurgitation, and constrictive pericarditis.
The jugular venous pressure is usually assessed by observing the right side of the patient's neck. The normal mean jugular venous pressure, determined as the vertical distance above the midpoint of the right atrium, is 6 to 8 cm H2O. Deviations from this normal range reflect either hypovolemia (i.e., mean venous pressure less than 5 cm H2O) or impaired cardiac filling (i.e., mean venous pressure greater than 9 cm H2O). The normal jugular venous pulse contains three positive waves. By convention these are labeled "a," "c", and "v" (Figure 19.1). These positive deflections occur, respectively, before the carotid upstroke and just after the P wave of the ECG (a wave); simultaneous with the upstroke of the carotid pulse (c wave); and during ventricular systole until the tricuspid valve opens (v wave). The a wave is generated by atrial contraction, which actively fills the right ventricle in end-diastole. The c wave is caused either by transmission of the carotid arterial impulse through the external and internal jugular veins or by the bulging of the tricuspid valve into the right atrium in early systole. The v wave reflects the passive increase in pressure and volume of the right atrium as it fills in late systole and early diastole. Normally the crests of the a and v waves are approximately equal in amplitude. The descents or troughs (Figure 19.1) of the jugular venous pulse occur between the "a" and "c" wave ("x" descent), between the "c" and "v" wave ("x" descent), and between the "v" and "a" wave ("y" descent). The x and x′ descents reflect movement of the lower portion of the right atrium toward the right ventricle during the final phases of ventricular systole. The y descent represents the abrupt termination of the downstroke of the v wave during early diastole after the tricuspid valve opens and the right ventricle begins to fill passively. Normally the y descent is neither as brisk nor as deep as the x descent.

Figure 19.1
Timing of the jugular venous pulse (JVP) is displayed in relation to the carotid arterial tracing, first (S1) and second (S2) heart sounds, and the electrocardiogram (ECG).
Evaluation of the jugular venous pulse is perhaps one of the most misunderstood and difficult to master physical diagnosis techniques. Once understood and practiced in a repetitive manner during each physical examination, the mysticism surrounding assessment of the jugular venous pulse disappears. Nevertheless, attention to a few basic points is crucial for proper examination of the venous pulse.
First, the patient must be positioned in a manner so that the physician can observe the venous pulse. Thus, the neck and chest must be bared to permit an unobstructed view from the midportion of the sternum to the antihelix of the ears. This requires that the dressing gown (preferrably opening to the patient's back) be positioned at the level of the nipples. Moreover, a woman's long hair should be tucked out of the way behind her head. Second, the patient should be reclining in a comfortable position. Except for patient comfort, the exact angle of inclination from horizontal is relatively unimportant. Indeed, this angle does not even need to be reported in the physical examination, since the mean venous pressure can be given in units of "centimeters of water," which is an absolute number. In general, patients who are dyspneic will not tolerate reclining at angles of less than 45 to 60 degrees from horizontal, and thus this should be the initial position of the head of the bed. Third, the examining table (or hospital bed) should be raised to a comfortable height for the physician. The cardiac examination—if performed properly—is time-consuming and must not be hurried; physical discomfort on the physician's part will detract from the adeptness of his bedside skills. Fourth, an adequate light source with a strong beam must be readily available. This source may be either a pocket flashlight (with a strong battery) or a bedside lamp that the physician can direct. Ambient room or window lighting is not usually as good as directed artificial lighting.
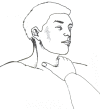
The light source is directed tangentially at approximately a 45-degree angle to the saggital plane from behind the right midscapular area across the right side of the neck toward the midline (Figure 19.2). The examiner should locate, by direct observation, the venous pulsations in the right side of the neck. Usually the patient's chin must be extended to enhance this observation. But care should be exercised so that the sternocleidomastoid muscle is not excessively tensed, thus compressing the external and internal jugular veins and obliterating their pulsations. It is crucial that the examiner be certain to distinguish between venous and arterial pulsations, and that the top of the venous column is recognized. The former is accomplished by seeking the three crests in the venous pulse and comparing them to the carotid arterial pulse. I find it easiest to observe the pulsations in the right side of the neck while timing the carotid pulse in the left side of the patient's neck using my right third finger (Figure 19.2). If I am still uncertain as to whether or not I am observing the venous pulse, I try to obliterate the venous pulse by placing my right thumb or index finger across the base of the patient's right neck (Figure 19.3). By compressing this area with a force of approximately 10 to 20 mm Hg, the venous pulse can be obliterated. Movement that remains will then be observed to have the characteristic monophasic contour of the carotid pulse. During this maneuver, it is important to continue to cast a tangential light across the right side of the neck in order to observe the contour of the various pulses.

 The next step is to determine the height of the mean jugular venous pressure, measured in centimeters of water, above the midpoint of the right atrium. The latter position is chosen because it is the standard reference point for all hemodynamic measurements in the catheterization laboratory. Moreover, the midpoint of the right atrium is at a constant fixed relationship (i.e., 5 cm) below the sternal angle of Louis regardless of the patient's anatomic position. Thus, whether the patient is lying flat or sitting erect, this anatomic relationship holds true. To determine the mean jugular venous pressure, the examiner should observe the nadir of the venous column on inspiration and then the crest of this column on expiration. Next, the midpoint of the excursion of the venous pulse during normal respiratory cycles is estimated visually. Exaggerated breathing or breath holding distorts the normal mean venous pressure and should be avoided. A horizontal line is drawn from this estimated point to intersect a vertical line, which is erected perpendicular to the ground through the sternal angle of Louis. The distance between the sternal angle and this intercept is measured (Figure 19.4). The sum of this distance—plus the obligatory 5-cm fixed relationship to the midpoint of the right atrium—represents the mean jugular venous pressure.
 Assuming that the top of the venous column has been observed, the degree of the patient's inclination from horizontal does not have to be stated. While a ruler may be used to measure the distance between the intercept and the sternal angle of Louis, this appliance may not always be readily available. If the width of the observer's fingers is known, these may serve the same purpose.
Next, the examiner observes the rise and fall of the venous pressure during normal inspiration and expiration. Normally, the mean venous pressure falls during inspiration. It is especially important that the patient does not perform a Valsalva maneuver or hold his breath during this procedure. Finally, the examiner applies firm but persistent pressure over the liver for 10 seconds while observing the mean jugular venous pressure. Normally there is either no rise or only a transient (i.e., 2 to 3 sec) rise in mean jugular venous pressure. A sustained increase in the mean venous pressure until abdominal compression is released is abnormal and indicates impaired right heart function. This abnormal response is called hepatojugular reflux. After determining the mean jugular venous pressure, the venous pulse contour should be examined by simultaneously observing the venous pulse in the right side of the neck while palpating the left carotid artery (Figure 19.2). A crest in the jugular venous pulse immediately preceding the carotid impulse is an "a" wave; that occurring with the carotid upstroke is the "c" wave; and that occurring after the carotid impulse has peaked is the "v" wave. The "a" wave and "c" waves occur relatively close together, while the "v" wave is observed to be separated from them by a longer interval.
First, the patient must be positioned in a manner so that the physician can observe the venous pulse. Thus, the neck and chest must be bared to permit an unobstructed view from the midportion of the sternum to the antihelix of the ears. This requires that the dressing gown (preferrably opening to the patient's back) be positioned at the level of the nipples. Moreover, a woman's long hair should be tucked out of the way behind her head. Second, the patient should be reclining in a comfortable position. Except for patient comfort, the exact angle of inclination from horizontal is relatively unimportant. Indeed, this angle does not even need to be reported in the physical examination, since the mean venous pressure can be given in units of "centimeters of water," which is an absolute number. In general, patients who are dyspneic will not tolerate reclining at angles of less than 45 to 60 degrees from horizontal, and thus this should be the initial position of the head of the bed. Third, the examining table (or hospital bed) should be raised to a comfortable height for the physician. The cardiac examination—if performed properly—is time-consuming and must not be hurried; physical discomfort on the physician's part will detract from the adeptness of his bedside skills. Fourth, an adequate light source with a strong beam must be readily available. This source may be either a pocket flashlight (with a strong battery) or a bedside lamp that the physician can direct. Ambient room or window lighting is not usually as good as directed artificial lighting.
The light source is directed tangentially at approximately a 45-degree angle to the saggital plane from behind the right midscapular area across the right side of the neck toward the midline (Figure 19.2). The examiner should locate, by direct observation, the venous pulsations in the right side of the neck. Usually the patient's chin must be extended to enhance this observation. But care should be exercised so that the sternocleidomastoid muscle is not excessively tensed, thus compressing the external and internal jugular veins and obliterating their pulsations. It is crucial that the examiner be certain to distinguish between venous and arterial pulsations, and that the top of the venous column is recognized. The former is accomplished by seeking the three crests in the venous pulse and comparing them to the carotid arterial pulse. I find it easiest to observe the pulsations in the right side of the neck while timing the carotid pulse in the left side of the patient's neck using my right third finger (Figure 19.2). If I am still uncertain as to whether or not I am observing the venous pulse, I try to obliterate the venous pulse by placing my right thumb or index finger across the base of the patient's right neck (Figure 19.3). By compressing this area with a force of approximately 10 to 20 mm Hg, the venous pulse can be obliterated. Movement that remains will then be observed to have the characteristic monophasic contour of the carotid pulse. During this maneuver, it is important to continue to cast a tangential light across the right side of the neck in order to observe the contour of the various pulses.

Figure 19.2
Drawing demonstrating the proper technique to evaluate the venous pulse. Note the positioning of the penlight with respect to the patient's neck, as well as the placement of the right third finger over the left carotid artery.

Figure 19.3
Drawing demonstrating the proper technique to obliterate the venous pulse by digital compression.

Figure 19.4
Drawing demonstrating measurement of the mean venous pressure with regard to the sternal angle of Louis. The mean venous pressure, as estimated in this manner, is remarkably similar to an exact value as determined by cardiac catheterization. (Redrawn; (more...)
Next, the examiner observes the rise and fall of the venous pressure during normal inspiration and expiration. Normally, the mean venous pressure falls during inspiration. It is especially important that the patient does not perform a Valsalva maneuver or hold his breath during this procedure. Finally, the examiner applies firm but persistent pressure over the liver for 10 seconds while observing the mean jugular venous pressure. Normally there is either no rise or only a transient (i.e., 2 to 3 sec) rise in mean jugular venous pressure. A sustained increase in the mean venous pressure until abdominal compression is released is abnormal and indicates impaired right heart function. This abnormal response is called hepatojugular reflux. After determining the mean jugular venous pressure, the venous pulse contour should be examined by simultaneously observing the venous pulse in the right side of the neck while palpating the left carotid artery (Figure 19.2). A crest in the jugular venous pulse immediately preceding the carotid impulse is an "a" wave; that occurring with the carotid upstroke is the "c" wave; and that occurring after the carotid impulse has peaked is the "v" wave. The "a" wave and "c" waves occur relatively close together, while the "v" wave is observed to be separated from them by a longer interval.
The anatomic relationships of the right internal and external jugular veins to the right atrium are important to an understanding of the clinical evaluation of the venous pulse. The right internal jugular vein communicates directly with the right atrium via the superior vena cava. There is a functional valve at the junction of the internal jugular vein and the superior vena cava. Usually, however, this valve does not impede the phasic flow of blood to the right atrium. Thus the wave form generated by phasic flow to the right atrium is accurately reflected in the internal jugular vein. The external jugular vein descends from the angle of the mandible to the middle of the clavicle at the posterior border of the sternocleidomastoid muscle. The external jugular vein possesses valves that are occasionally visible. The relatively direct line between the right external and internal jugular veins, as compared to the left external and internal jugular veins, make the right jugular vein the preferred system for assessing the venous pressure and pulse contour. While it has been suggested that blood flow within the external jugular vein is nonpulsatile and thus cannot be used to assess the contour of the jugular venous pulse, my exerience is contrary to this view. Thus, either the external or internal jugular vein may be useful in the assessment of mean venous pressure and pulse contour.
In determining mean jugular venous pressure, one assumes that the filling pressure of the right atrium and right ventricle mirror that of the left atrium and left ventricle. This relationship is usually correct. Thus, a mean jugular venous pressure greater than 10 cm H2O usually indicates volume overload, while a low jugular venous pressure (i.e., less than 5 cm H2O) usually indicates hypovolemia. But there are important, notable exceptions to this relationship. First, acute left ventricular failure (as may be caused by a myocardial infarction) may significantly raise the pulmonary capillary wedge pressure without raising the mean right atrial and jugular venous pressures. Second, pulmonary hypertension, tricuspid insufficiency, or stenosis may be associated with elevated mean right atrial and jugular venous pressures while leaving the left heart pressures unaffected. In using the mean jugular venous pressure in clinical practice, the physician must correlate this bedside measurement with the other information gained from the history and physical examination.
In determining mean jugular venous pressure, one assumes that the filling pressure of the right atrium and right ventricle mirror that of the left atrium and left ventricle. This relationship is usually correct. Thus, a mean jugular venous pressure greater than 10 cm H2O usually indicates volume overload, while a low jugular venous pressure (i.e., less than 5 cm H2O) usually indicates hypovolemia. But there are important, notable exceptions to this relationship. First, acute left ventricular failure (as may be caused by a myocardial infarction) may significantly raise the pulmonary capillary wedge pressure without raising the mean right atrial and jugular venous pressures. Second, pulmonary hypertension, tricuspid insufficiency, or stenosis may be associated with elevated mean right atrial and jugular venous pressures while leaving the left heart pressures unaffected. In using the mean jugular venous pressure in clinical practice, the physician must correlate this bedside measurement with the other information gained from the history and physical examination.
Elevation in Mean Venous Pressure without Distention in External Jugular Veins
This combination is perhaps the most frequently missed physical finding in the cardiovascular examination and usually occurs in the patient with severe biventricular congestive heart failure, constrictive pericarditis, or cardiac tamponade. Upon examination, the external jugular veins are not observed to be distended when the patient is lying with his head elevated at 45 to 60 degrees. The clue to determing the mean venous pressure correctly in such instances is to search for the presence of pulsations higher up in the neck, usually around the level of the earlobe. Occasionally the examiner must have the patient sit erect or even stand in order to observe the top of the venous column of blood. Next, the examiner should compress the junction of the external–internal jugular veins with his thumb while observing the movement in the neck. With firm, even pressure of approximately 20 cm H2O (well below systolic blood pressure), the pulsations in the neck will be observed to cease—or at least become significantly reduced in amplitude. Under such circumstances the correct measurement of the jugular venous pressure can be made. The cause of this dissociation is uncertain, although venoconstriction from the marked elevations in plasma catecholamines that accompany these pathologic states are usually cited.Abnormalities in Systolic Waves
Giant a waves are classically described as "leaping to the eye" and are greater in height than usually perceived (Figure 19.5). There are only two causes of giant a waves: decreased right ventricular compliance or tricuspid stenosis. Causes of the former are pulmonary valve stenosis, chronic obstructive pulmonary disease with associated pulmonary hypertension, or restrictive cardiomyopathy, each of which decreases right ventricular compliance. In these conditions the force of right atrial contraction is increased and generates a giant a wave during atrial systole. As pulmonic valve stenosis and tricuspid stenosis are uncommon diseases in adults, giant a waves almost invariably indicate either pulmonary arterial hypertension or a restrictive cardiomyopathy involving the right ventricle.
Figure 19.5
Phonocardiogram and jugular venous pulse tracing from a middle-aged man with pulmonary hypertension (pulmonary artery pressure 70 mm Hg) caused by cardiomyopathy. The jugular venous pulse tracing demonstrates a prominent a wave without a c or v wave being (more...)
Inspiratory Rise in Mean Venous Pressure
Normally, the mean venous pressure falls during passive inspiration as phasic flow of blood occurs in the superior vena cava and the right ventricle accommodates this increased venous return. When constrictive pericarditis is present, phasic blood flow does not occur in the superior vena cava. Thus, during inspiration the mean venous pressure rises (Kussmaul's sign). Unfortunately, this sign is sensitive but not specific for constrictive pericarditis and may also be observed in right ventricular infarctions or restrictive cardiomyopathies.Cannon "a" waves are abnormalities in the a wave that occur when right atrial contraction takes place against a closed tricuspid valve (Figure 19.6). The classic condition in which this disordered cardiac contraction occurs is complete heart block. If atrial contraction occurs at an appropriate time during a ventricular ectopic beat, however, cannon "a" waves may also be observed. If irregular cannon "a" waves are observed in a patient with tachycardia, the dysrhythmia is likely to be ventricular tachycardia. Unlike giant "a" waves, which are uniform in height and are observed during each cardiac cycle, cannon "a" waves are variable in height and occur sporadically because of the variable realtionship of atrial contraction to ventricular systole.

Figure 19.6
Right atrial pressure tracing and EGG showing cannon a wave (arrow) occurring simultaneously with a PVC. These waves occur when the right atrium contracts against a closed tricuspid valve. (Courtesy of Dr. W. Proctor Harvey.)
"CV" waves of tricuspid insufficiency may also be seen. Unlike the normal jugular venous contour, patients with marked tricuspid insufficiency have "c" and "v" waves that merge to produce a broad positive wave called a "cv" wave, which occurs simultaneously with the carotid pulse (Figure 19.7). Lesser degrees of tricuspid insufficiency are associated with "v" waves, which are not quite as broad and in which there may be clear separation from the "c" wave.
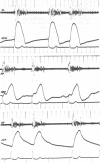
Figure 19.7
Apex cardiogram (ACG), hepatic pulsation (HEP), jugular venous pulse tracing (JVP), and phonocardiogram at the cardiac apex and fourth left interspaces (4L and AP) in a middle-aged woman with severe tricuspid regurgitation caused by mitral insufficiency. (more...)
Abnormalities in Diastolic Descents
Brisk x and y descents may occur during diastole. Usually, the descents in the jugular venous pulse are brisk but not excessively rapid, and the x descent is characteristically deeper than the y descent. When right ventricular filling becomes hindered (i.e., in the setting of constrictive pericarditis or right ventricular failure), these descents become unusually rapid. In such instances, the contour of the jugular venous pulse may be described as "flicking," and the x and y descents may be said to describe a "W" or "M" shaped pattern (Figure 19.8). While such description is obviously somewhat subjective, careful observation in a few patients who have these diseases will verify the veracity of such observations. Moreover, in constrictive pericarditis, the y descent is often deeper than the x descent (Friedreich's sign).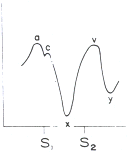
Figure 19.8
Drawing of jugular venous pulse showing rapid x and y descents as may be noted in constrictive pericarditis.
- Ewy GA, Marcus FI. Bedside estimation of the venous pressure. Heart Bull. 1968;17:41–44.
- Perloff JK. Physical examination of the heart and circulation, Philadelphia: W.B. Saunders, 1982.
Figures
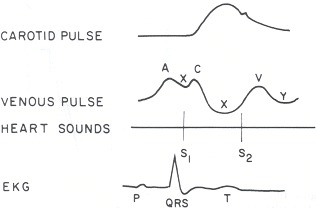
Figure 19.1
Timing of the jugular venous pulse (JVP) is displayed in relation to the carotid arterial tracing, first (S1) and second (S2) heart sounds, and the electrocardiogram (ECG).
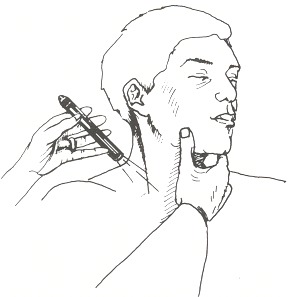
Figure 19.2
Drawing demonstrating the proper technique to evaluate the venous pulse. Note the positioning of the penlight with respect to the patient's neck, as well as the placement of the right third finger over the left carotid artery.
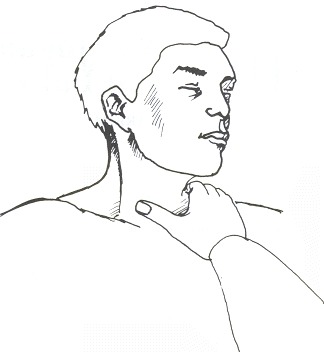
Figure 19.3
Drawing demonstrating the proper technique to obliterate the venous pulse by digital compression.

Figure 19.4
Drawing demonstrating measurement of the mean venous pressure with regard to the sternal angle of Louis. The mean venous pressure, as estimated in this manner, is remarkably similar to an exact value as determined by cardiac catheterization. (Redrawn; courtesy of Dr. W. Proctor Harvey.)

Figure 19.5
Phonocardiogram and jugular venous pulse tracing from a middle-aged man with pulmonary hypertension (pulmonary artery pressure 70 mm Hg) caused by cardiomyopathy. The jugular venous pulse tracing demonstrates a prominent a wave without a c or v wave being observed. The phonocardiograms (fourth left interspace and cardiac apex) show a murmur of tricuspid insufficiency and ventricular and atrial gallops.
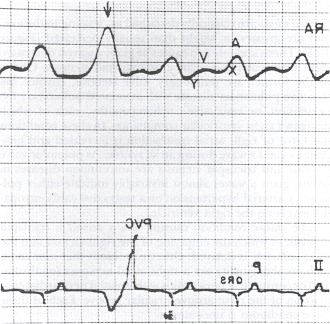
Figure 19.6
Right atrial pressure tracing and EGG showing cannon a wave (arrow) occurring simultaneously with a PVC. These waves occur when the right atrium contracts against a closed tricuspid valve. (Courtesy of Dr. W. Proctor Harvey.)
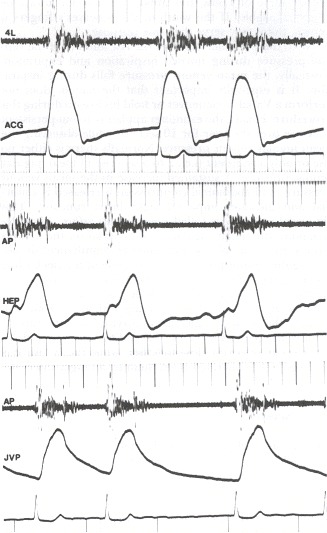
Figure 19.7
Apex cardiogram (ACG), hepatic pulsation (HEP), jugular venous pulse tracing (JVP), and phonocardiogram at the cardiac apex and fourth left interspaces (4L and AP) in a middle-aged woman with severe tricuspid regurgitation caused by mitral insufficiency. Note the "cv " in the venous pulse, which is transmitted to the liver. These findings are diagnostic of tricuspid insufficiency.
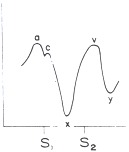
Figure 19.8
Drawing of jugular venous pulse showing rapid x and y descents as may be noted in constrictive pericarditis.
Copyright © 1990, Butterworth Publishers, a division of Reed Publishing.
Không có nhận xét nào:
Đăng nhận xét